Updated and verified | April 5, 2026
Peak, pullback, current spot, and forecast outlook from the 2026 peak to today.
Gold & Silver a glance
| Line item | Gold | Silver |
|---|---|---|
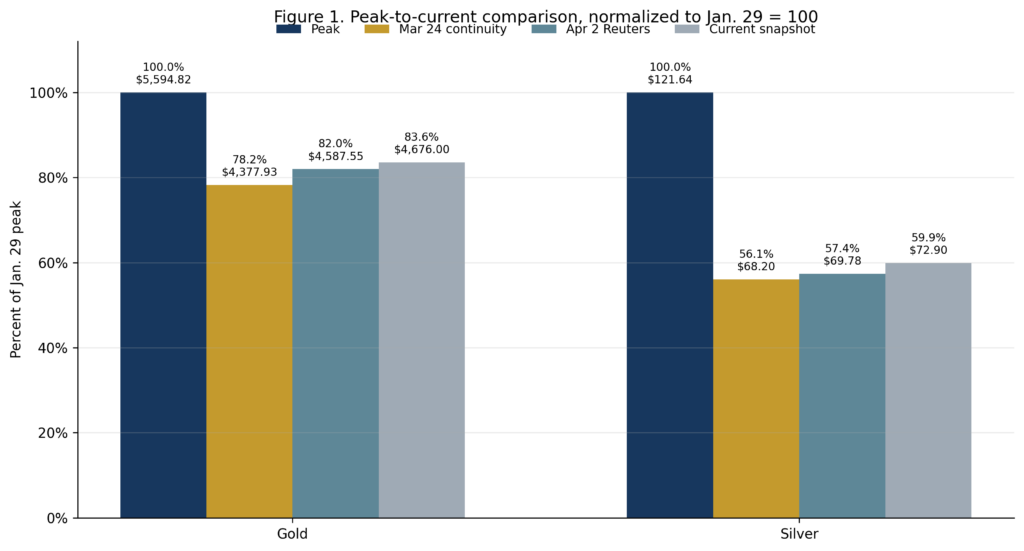
| Jan. 29 peak | $5,594.82/oz | $121.64/oz |
| Mar. 24 continuity snapshot | $4,377.93/oz | $68.20/oz |
| Apr. 2 Reuters spot | $4,587.55/oz | $69.78/oz |
| Apr. 5 current reference | $4,677.00/oz | $73.03/oz |
| Peak to current | -$917.82 (16.4%) | -$48.61 (40.0%) |
| Since Apr. 2 | +$89.45 (1.9%) | +$3.25 (4.7%) |
What changed in this refresh
- The March 24 and Apr. 2 comparison lines stay in place.
- The new current line uses an Apr. 5 closed-market midpoint, cross-checked against TradingEconomics.
- The volatility section now uses Apr. 2 Cboe proxy closes because options markets were shut when the current line was taken.
The verified price reset
Gold and silver still look very different from the late-January blow-off top. After gold hit $5,594.82 per ounce and silver hit $121.64 on Jan. 29, the prior version of this piece locked in a March 24 Reuters-syndicated snapshot of $4,377.93 for gold and $68.20 for silver. Reuters then printed an Apr. 2 market line at $4,587.55 and $69.78 before the Good Friday shutdown. With spot trading closed on Apr. 5, Kitco’s 11:37 a.m. EST midpoint points to about $4,677.00 for gold and $73.03 for silver, almost exactly in line with TradingEconomics’ $4,677.28 and $72.99 check.
That leaves gold down $917.82, or 16.4%, from the Jan. 29 peak while silver remains down $48.61, or 40.0%. Gold has recovered to 83.6% of its peak; silver has only clawed back to 60.0%. The bigger point has not changed: even after the correction, pricing remains historically elevated because 2025 itself was extraordinary. Reuters put gold’s 2025 gain at about 64% and silver’s at roughly 147%.
Why the market is still violent
Gold can still benefit from safe-haven demand, but it struggles when war-driven oil strength and a firmer dollar push markets to price fewer rate cuts. That has been the dominant March-to-April story. Silver remains the higher-beta trade. It still has structural support from retail investment and a projected sixth straight market deficit, but it is more exposed than gold to speculative unwinds and weaker industrial demand.
What Cook County sellers should do now
The original post was directionally right about stress in the physical chain. Metalor briefly paused new shipments during the January spike, and Reuters reported APMEX imposed temporary minimums while processing record two-way flows. That context still matters locally: headline spot can move faster than neighborhood buy spreads, especially in silver.
For Cook County sellers, the cleanest decision rule is still same-day comparison shopping. Ask to see testing and weighing, compare quotes within the same day, and understand whether an item is being priced as bullion, melt scrap, or a collectible. In a volatility regime like this one, spread discipline matters almost as much as spot price.
Peak-to-current volatility map
The chart below keeps the earlier March 24 snapshot intact, adds the month-end bounce, the Apr. 2 reversal, and the new Apr. 5 reference line. It shows that the correction is still active rather than finished.
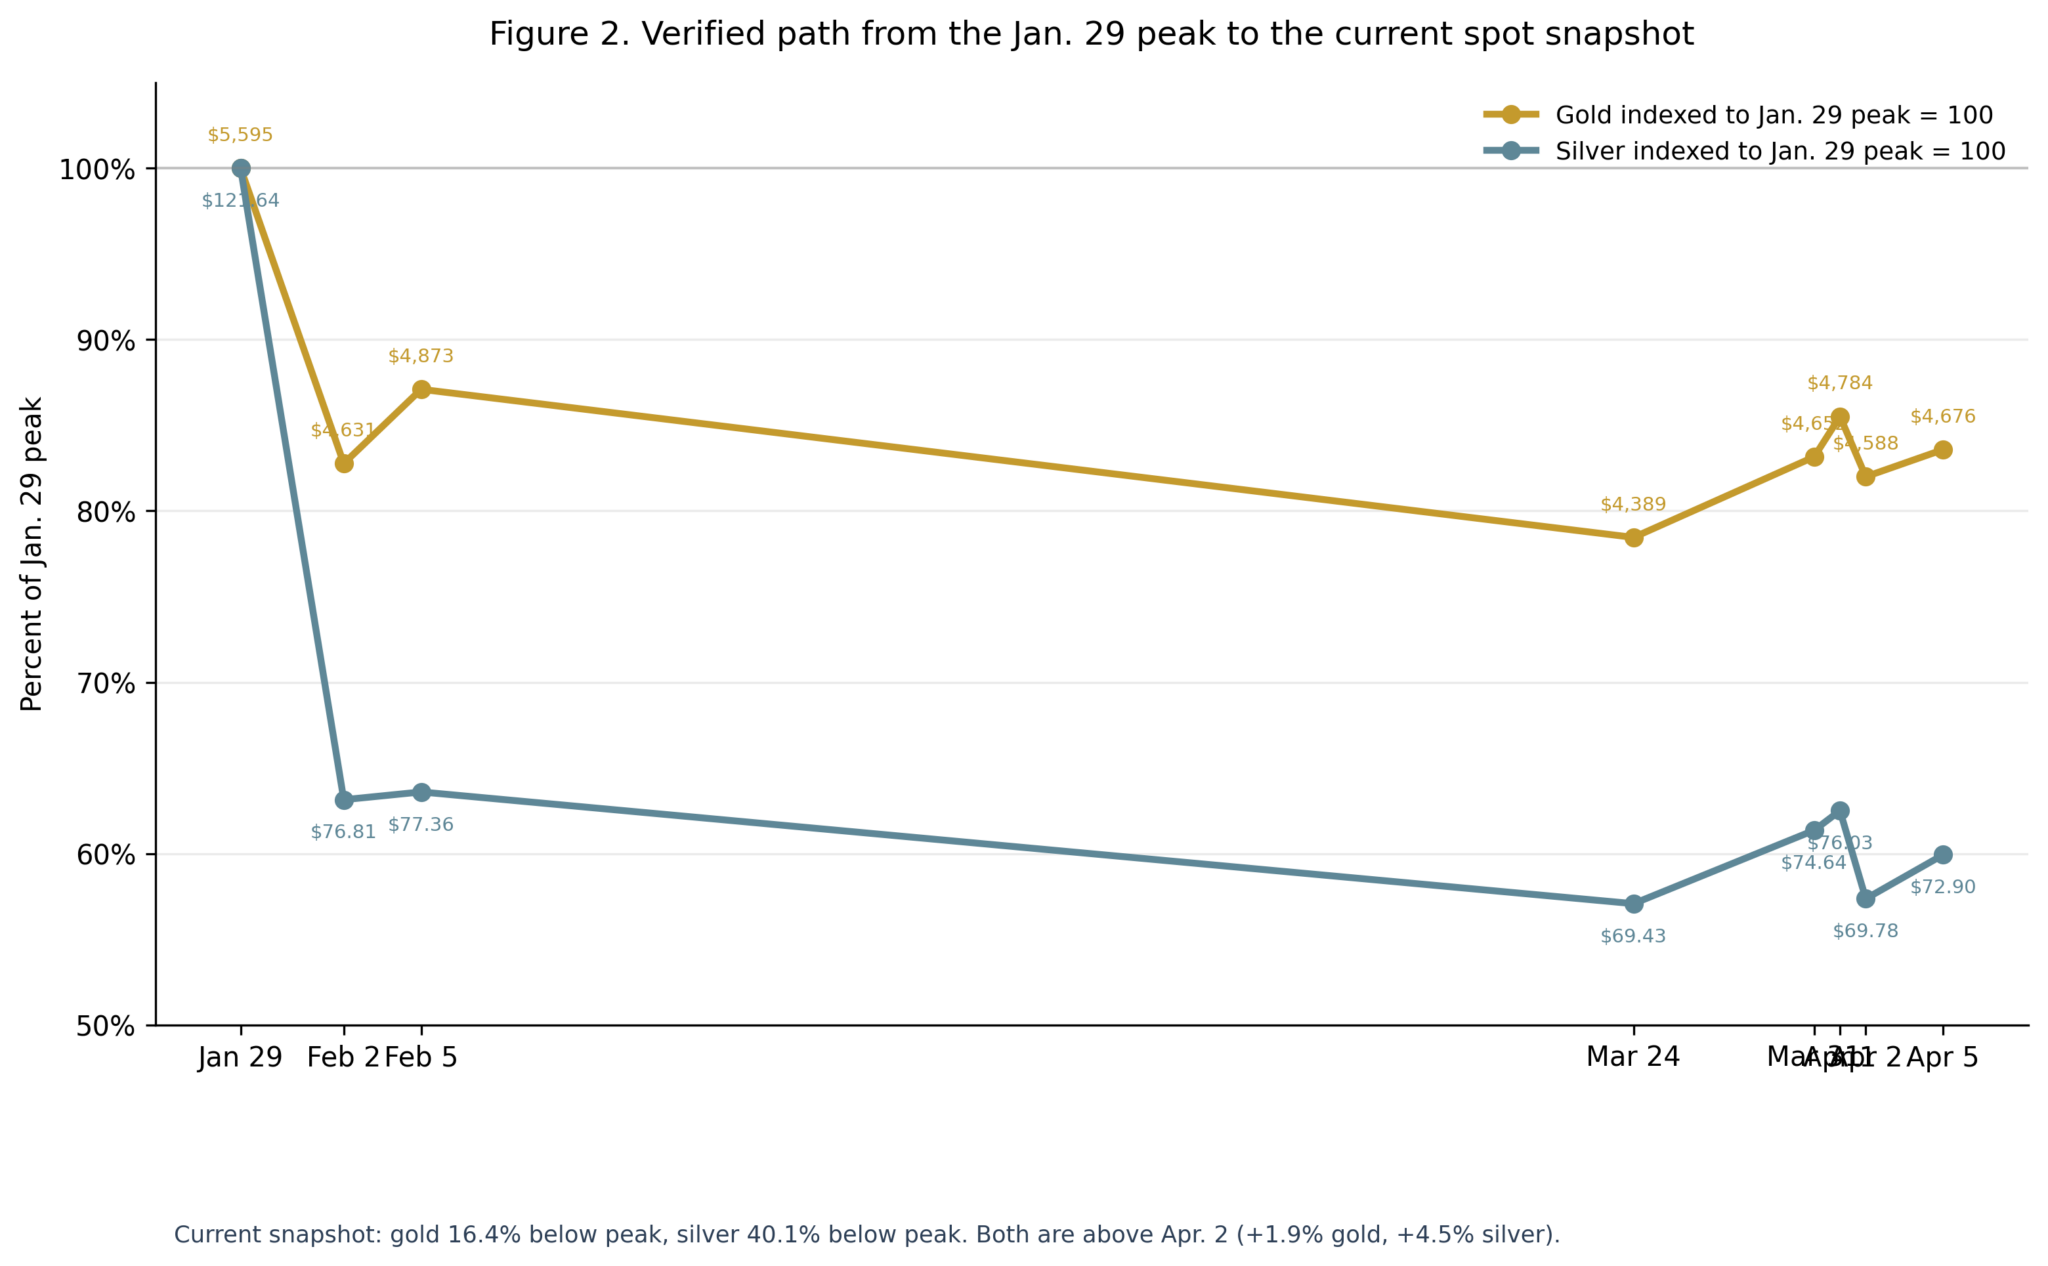
Verification note: The Mar. 24 line deliberately retains the earlier Reuters-syndicated $4,377.93 / $68.20 snapshot used in the prior version. Reuters’ direct Mar. 24 page later updated to $4,389.26 / $69.43. The Apr. 5 line is a closed-market midpoint, not a fresh Reuters weekday print.
Dated price checks used in this version
| Date | Gold spot / oz | Silver spot / oz |
|---|---|---|
| Jan. 29 peak | $5,594.82 | $121.64 |
| Feb. 2 | $4,630.59 | $76.81 |
| Feb. 5 | $4,872.83 | $77.36 |
| Mar. 24 | $4,377.93 | $68.20 |
| Mar. 31 | $4,652.31 | $74.64 |
| Apr. 1 | $4,784.22 | $76.03 |
| Apr. 2 | $4,587.55 | $69.78 |
| Apr. 5 current | $4,677.00 | $73.03 |
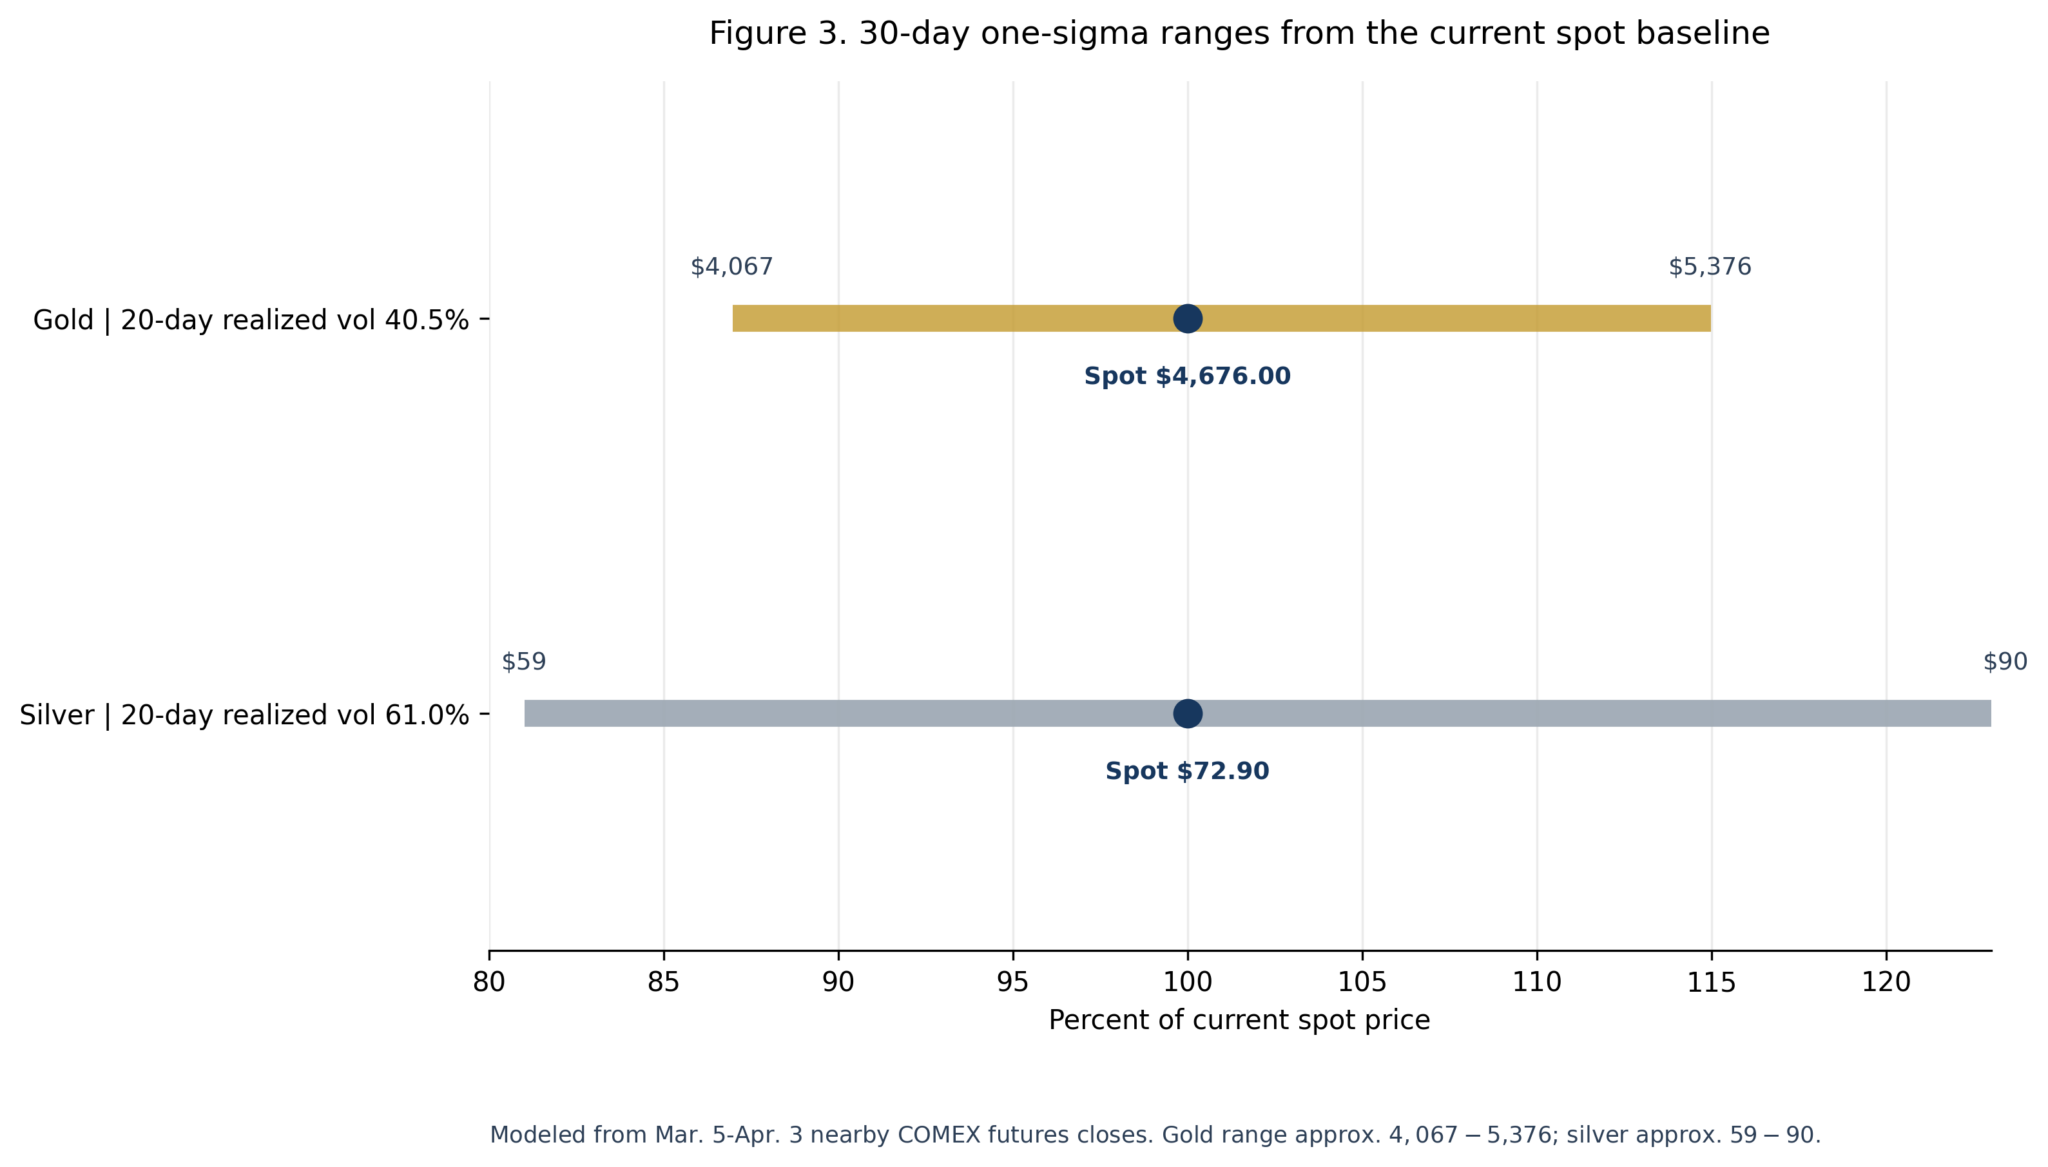
Forecast and volatility outlook
The forecast section below is a transparent model, not a fact claim. Direction comes from Reuters consensus, bank targets, the LBMA silver survey, and the Silver Institute’s supply outlook. Near-term volatility is estimated from Apr. 2 closes in Cboe’s GVZ and VXSLV proxies, then anchored to the current Apr. 5 reference line.
My working base case remains gold around $5,000 per ounce by year-end 2026 and silver around $80. From today’s reference line, that implies about 6.9% upside in gold and 9.5% in silver. In plain English, the model assumes the current correction cools but does not fully erase the structural support from central-bank buying, de-dollarization, and silver’s still-tight physical market.
| Metal | Apr. 5 reference | Proxy 30-day range | Working year-end base case | Scenario lane |
|---|---|---|---|---|
| Gold | $4,677.00 | $4,169 to $5,185 | Around $5,000 | Bear $4,300 | Bull $5,900 |
| Silver | $73.03 | $58 to $88 | Around $80 | Bear $60 | Bull $100 |
Interpretation: the 30-day ranges are one-sigma bands, not hard limits. They describe what a normal turbulent month could look like if volatility stays near the Apr. 2 close. Silver still has the wider swing profile, which is why local spreads and timing matter more there.
Forecast anchors behind the base case: Reuters’ 2026 averages are $4,746.50 for gold and $79.50 for silver; BMI keeps gold at a $4,600 annual average; Goldman sees $5,400 by year-end; J.P. Morgan still points to $6,300; BNP Paribas sees silver in a $65 to $75 range; LBMA’s survey average is $90 with a $50 to $120 analyst band; and the Silver Institute still expects a sixth straight global deficit.
Quick verification summary
| Original point | Verified / corrected figure | Result |
|---|---|---|
| Peak figures near $5,600 gold and $121 silver. | Reuters printed $5,594.82 for gold and $121.64 for silver on Jan. 29. | Verified when rounded. |
| 2025 gains around 65% gold and 150% silver. | Reuters put gold at about 64% in 2025 and silver at roughly 147%. | Directionally right. |
| Feb. 5 spot levels and drawdown math. | Correct values were $4,872.83 for gold and $77.36 for silver; the original comparison overstated the drop. | Corrected. |
| Physical pipeline stress in January. | Bloomberg verified a Metalor backlog; Reuters verified APMEX minimums during record two-way flows. | Verified with tighter wording. |
| Mar. 24 “today” line from the prior version. | The earlier Reuters-syndicated $4,377.93 / $68.20 print is retained; Reuters later updated the direct page to $4,389.26 / $69.43. | Clarified. |
| Apr. 2 refreshed market line. | Reuters had gold at $4,587.55 and silver at $69.78. | Added. |
| Apr. 5 current reference line. | Kitco midpoint = $4,677.00 gold and $73.03 silver; TradingEconomics was nearly identical. | Added. |
| Forecast and volatility section. | Uses GVZ 37.85 and VXSLV 71.68 as proxies, plus Reuters / LBMA / J.P. Morgan / Silver Institute anchors. | Labeled clearly. |
Source notes
- Original article: Cook County Gold & Silver Market Update, dated Feb. 2, 2026.
- Reuters, Jan. 29, 2026: gold hit $5,594.82 and silver hit $121.64.
- Reuters, Jan. 6 / Feb. 4 / Feb. 25, 2026: gold gained about 64% in 2025; silver roughly 147%.
- Reuters, Feb. 2 and Feb. 5, 2026: post-peak spot levels at $4,630.59 / $76.81 and then $4,872.83 / $77.36.
- Bloomberg, Jan. 29, 2026: Metalor paused inbound shipments during a backlog; Reuters described APMEX minimums during record flows.
- Reuters, Mar. 24, 2026: direct-page update later showed $4,389.26 / $69.43; this document keeps the earlier syndicated $4,377.93 / $68.20 line for continuity.
- Reuters, Mar. 31 and Apr. 1, 2026: rebound prints of $4,652.31 / $74.64 and then $4,784.22 / $76.03.
- Reuters, Apr. 2, 2026: $4,587.55 gold and $69.78 silver; Reuters published no Friday metals report for Apr. 3 because of Good Friday.
- Kitco, Apr. 5, 2026: closed-market bid/ask midpoint implies about $4,677.00 for gold and $73.03 for silver; TradingEconomics updated Apr. 5 at roughly $4,677.28 and $72.99.
- Reuters, Feb. 4, Mar. 31, and Feb. 25: median 2026 averages of $4,746.50 gold and $79.50 silver; BMI $4,600, Goldman $5,400 year-end, J.P. Morgan $6,300, BNP silver $65-$75.
- LBMA 2026 survey: silver average $90 with a $50 to $120 analyst range; Silver Institute / Reuters, Feb. 10: sixth straight global deficit of 67 million ounces expected in 2026.
- Cboe / Yahoo Finance, Apr. 2 close: GVZ 37.85 and VXSLV 71.68 used here as volatility proxies.
Publication note: Spot prices can move materially within hours. If this piece is published after Apr. 5, rerun the current line and proxy-vol inputs before posting. The forecast section is a working scenario model, not investment advice.